AIOps Consulting & Readiness: Transitioning from Reactive Operations to Predictive Analytics
Introduction
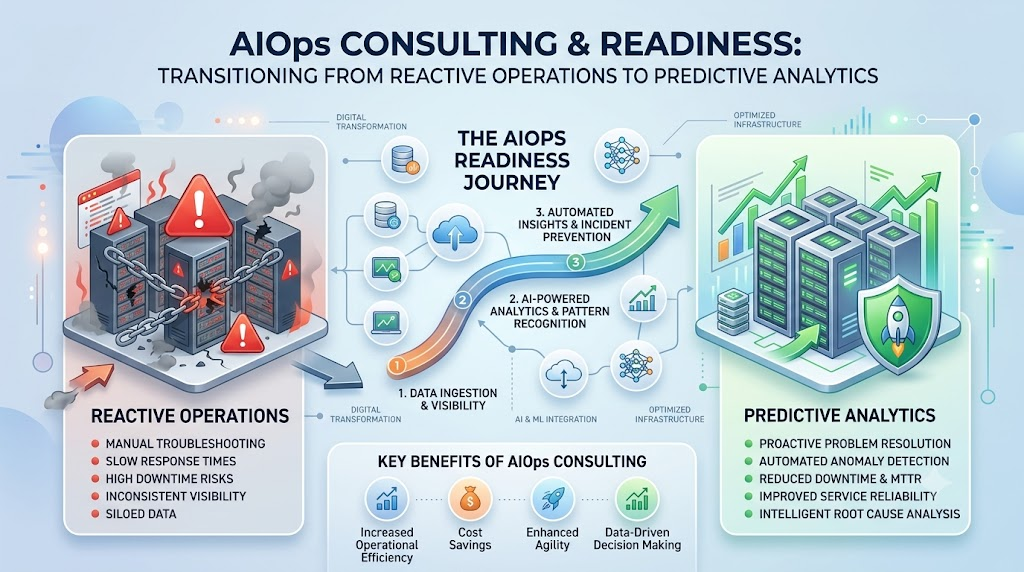
Modern software systems generate unprecedented operational telemetry. Cloud-native architectures, container orchestration platforms, and distributed microservices stream millions of performance signals every second. For Site Reliability Engineers (SREs) and system administrators, relying on static alerting rules to maintain system health has become unsustainable. Traditional thresholds trigger endless non-actionable pages, hide real infrastructure failures within massive alert storms, and inflate Mean Time to Resolution (MTTR).
TheAIOps provides practical frameworks to help engineering teams navigate this complexity. By applying machine learning, statistical modeling, and automated workflows to real-time telemetry, Artificial Intelligence for IT Operations converts overwhelming signal streams into clear, context-aware operational guidance. This technical guide examines fundamental AIOps design patterns, architectural layers, implementation strategies, and practical considerations for engineering dependable operational pipelines.
Understanding the Core AIOps Concept
What is AIOps?
AIOps—short for Artificial Intelligence for IT Operations—refers to the application of big data engineering, machine learning algorithms, and intelligent automation to modern IT operations.
At its core, AIOps bridges three distinct technical domains:
+-------------------------------------------------------------+
|                     UNIFIED TELEMETRY                       |
|    (Metrics, Unstructured Logs, Distributed Traces, Topology)   |
+------------------------------+------------------------------+
                               |
                               v
+-------------------------------------------------------------+
|                     ANALYTICAL ENGINE                       |
|   (Statistical Baselines, Dynamic Clustering, NLP, Topology)  |
+------------------------------+------------------------------+
                               |
                               v
+-------------------------------------------------------------+
|                   PROGRAMMATIC EXECUTION                    |
|  (Contextual Triage, Root-Cause Mapping, Runbook Automation)|
+-------------------------------------------------------------+
Rather than attempting to eliminate human operations, AIOps acts as a continuous analysis layer that filters noise, connects related failure modes, and presents actionable context to engineering teams.
Traditional IT Monitoring vs. Algorithmic Operations
Legacy monitoring relies on rigid conditional logic. For instance, a system administrator might define a trigger: “Page the primary SRE if HTTP 500 responses exceed 2% of total traffic over a 3-minute rolling window.”
In modern dynamic systems, static rules fail due to several fundamental factors:
- Context Blindness: A daily batch ETL job causing CPU usage to hit 98% every night at midnight generates false alarms if the system cannot account for cyclical routines.
- Cascading Signal Noise: When a upstream gateway drops connections, dozens of downstream microservices simultaneously report timeout errors, flooding the on-call engineer with redundant notifications.
- Silent Performance Degradation: A slow memory leak or network packet drop rate that degrades application throughput while remaining below fixed static limits will evade standard threshold alerts entirely.
AIOps introduces continuous dynamic baselining. By evaluating historical behavior across daily, weekly, and seasonal cycles, machine learning models calculate acceptable operating bounds dynamically. When metrics diverge from normal historical profiles, the system flags an anomaly without requiring manual alert adjustments.
Key Capabilities of Artificial Intelligence for IT Operations
1. Telemetry Ingestion and Normalization
AIOps platforms process high-velocity data streams across distinct operational formats:
- Metrics: Time-series numerical measurements representing resource utilization, throughput, and system health.
- Logs: Semi-structured or unstructured event records emitted by applications, operating systems, and underlying hardware.
- Traces: Distributed end-to-end request journeys across service boundaries (e.g., OpenTelemetry spans).
- Topology: Dynamic structural maps detailing dependencies between microservices, cloud resources, and physical hardware.
AIOps systems use streaming data pipelines to aggregate, parse, and structure these disparate telemetry sources into unified, queryable event models.
2. Statistical and Algorithmic Anomaly Detection
Instead of static boundaries, anomaly detection systems evaluate behavioral shifts using specialized mathematical techniques:
- Time-Series Decomposition: Isolating underlying trends, cyclic seasonality, and unpredictable noise within time-series metrics.
- Unsupervised Clustering: Applying algorithms like Isolation Forests or DBSCAN to flag multidimensional anomalies without requiring pre-labeled training datasets.
- Dynamic Banding: Computing rolling standard deviations and confidence intervals to adjust alert thresholds dynamically based on time-of-day or day-of-week patterns.
3. Cross-Domain Event Correlation
Event correlation transforms fragmented system signals into consolidated incidents. Effective strategies include:
- Temporal Grouping: Aggregating alerts originating within overlapping time windows.
- Topological Graph Analysis: Leveraging service-dependency trees to group infrastructure alerts with corresponding application-level failures.
- Semantic Analysis: Using Natural Language Processing (NLP) techniques like tokenization and term frequency analysis to identify structural similarities across log lines.
4. Automated Root-Cause Identification
Once related events are correlated, the system maps the failure progression back to its probable origin. By cross-referencing operational telemetry with change management feeds (such as software deployments, configuration updates, or infrastructure scaling events), AIOps platforms highlight the initial state change that triggered the failure chain.
[ Git Deployment ] ---> [ DB Migration Executed ] ---> [ Latency Spike ] ---> [ Pod OOMKilled ]
        ^                                                                          |
        |====================== Identified Primary Fault Source ===================|
Engineers receive a single prioritized incident narrative rather than isolated pages across multiple telemetry dashboards.
Architectural Layers of an AIOps Platform
Designing an enterprise-ready AIOps ecosystem requires structuring core capabilities into distinct functional tiers:
+-------------------------------------------------------------------------------+
|                            ACTION & ITSM INTERFACE                            |
|             (ServiceNow, Jira, Slack Ops Bots, Webhook Integrations)           |
+---------------------------------------^---------------------------------------+
                                        |
+---------------------------------------+---------------------------------------+
|                       PROGRAMMATIC AUTOMATION TIER                            |
|            (Ansible Execution, Kubernetes Operators, Cloud APIs)              |
+---------------------------------------^---------------------------------------+
                                        |
+---------------------------------------+---------------------------------------+
|                    ANALYTICS & ML INFERENCE ENGINE                            |
|   [ Anomaly Scoring ]  [ Correlation Graph ]  [ Root-Cause Inference ]        |
+---------------------------------------^---------------------------------------+
                                        |
+---------------------------------------+---------------------------------------+
|                    STREAM PROCESSING & INGESTION TIER                         |
|                 (Apache Kafka, Flink, Vector, Logstash Pipelines)             |
+---------------------------------------^---------------------------------------+
                                        |
+---------------------------------------+---------------------------------------+
|                             TELEMETRY SOURCE LAYER                            |
|     (Prometheus, OpenTelemetry Collectors, CloudWatch, Syslog Streams)        |
+-------------------------------------------------------------------------------+
Comparative Analysis of IT Operational Models
Positioning AIOps within modern software engineering demonstrates how it reinforces existing operational methodologies:
| Operational Area | Traditional IT Ops | DevOps Strategy | Site Reliability Engineering (SRE) | Artificial Intelligence for IT Operations |
| Primary Focus | Manual resource management | Continuous delivery & shared ownership | Service reliability & toil reduction | Algorithmic signal processing & decision support |
| Telemetry Usage | Static threshold alerts | Deployment pipelines & build metrics | Service Level Indicators (SLIs) and SLOs | Cross-domain multi-source telemetry ingestion |
| Incident Handling | Manual triage via static runbooks | On-call developer rotas | Automated failovers & post-mortems | ML-driven alert suppression & root-cause mapping |
| Operational Scale | Linear (scales with human team size) | Moderate (scaled via automation scripts) | High (scaled via software engineering practices) | Maximum (scaled via continuous machine learning) |
Practical Engineering Scenarios
Scenario 1: Mitigating Cascade Failures in Distributed Storage
- Context: A storage cluster network interface encounters silent packet drops, causing slow I/O across downstream API instances.
- Legacy Approach: Monitoring generates 150+ separate alerts for API timeouts, queue depth warnings, and database connection pool exhaustion. On-call engineers spend critical time determining which service failed first.
- AIOps Approach: The system ingests the alert stream, correlates the events using the infrastructure topology map, and suppresses downstream warnings. It produces a consolidated incident report: “Storage Node-03 Network Interface Dropping Packets — 12 Dependent Microservices Impacted.”
Scenario 2: Detecting Gradual Resource Degradation
- Context: A microservice release introduces a minor goroutine leak that slowly consumes system memory over several days.
- Legacy Approach: Memory alerting is hardcoded at 85%. For six days, memory usage creeps upward without breaching limits. On day seven, the service experiences an Out-Of-Memory (OOM) panic during peak customer usage.
- AIOps Approach: Statistical time-series models detect that memory growth deviates from established cyclical norms. The system raises an anomaly ticket four days before memory limit exhaustion, enabling engineers to inspect the leak during normal business hours.
Scenario 3: Automated Self-Healing for Ephemeral Issues
- Context: A worker node occasionally accumulates orphaned temporary files, eventually filling its local cache disk.
- Legacy Approach: An engineer receives an off-hours page, manually authenticates to the host, runs a standard cleanup command, and closes the alert.
- AIOps Approach: The platform identifies the disk usage anomaly, verifies that the host is tagged as a stateless worker node, and automatically triggers a constrained cleanup task via a Webhook. The issue resolves autonomously and records an audit log entry.
Evaluating AIOps Tools and Technical Capabilities
Selecting appropriate AIOps Tools requires evaluating technical alignment across core functional areas rather than relying on vendor product summaries:
                  +-----------------------------------+
                  |   AIOPS EVALUATION REQUIREMENTS   |
                  +-----------------------------------+
                                    |
         +--------------------------+--------------------------+
         |                                                     |
         v                                                     v
+--------------------------+                         +--------------------------+
| DATA & INTEGRATION TIER  |                         | ANALYTICS & SAFETY TIER  |
| - OpenTelemetry standards|                         | - Explainable ML outputs |
| - High-cardinality store |                         | - Dynamic topology graph |
| - Real-time stream APIs  |                         | - Strict execution limits|
+--------------------------+                         +--------------------------+
Core technology categories include:
- Observability Ingestion Platforms: Systems like Datadog, Dynatrace, and New Relic gather full-stack metrics, traces, and logs natively to establish baseline system visibility.
- Event Correlation Engines: Platforms such as BigPanda, PagerDuty Event Intelligence, and Moogsoft aggregate multi-source alerts to deduplicate noise and reconstruct incident timelines.
- ITSM Workflow Tools: Solutions like ServiceNow ITOM integrate algorithmic insights into change management records, asset databases, and incident routing workflows.
- Automation Orchestrators: Tools like Ansible Automation Platform, SaltStack, and custom Kubernetes Controllers execute targeted corrective runbooks within defined safety boundaries.
Step-by-Step AIOps Implementation Strategy
Successfully integrating AIOps into an operational environment requires a phased approach prioritizing telemetry health, process alignment, and technical safety.
+-------------------------------------------------------------------------+
| PHASE 1: Audit Infrastructure & Telemetry Health                        |
| Map existing monitoring tools, log structures, and metric cardinality.  |
+-------------------------------------------------------------------------+
                                     |
                                     v
+-------------------------------------------------------------------------+
| PHASE 2: Standardize & Unify Data Pipelines                            |
| Implement structured logging formats and adopt OpenTelemetry standards. |
+-------------------------------------------------------------------------+
                                     |
                                     v
+-------------------------------------------------------------------------+
| PHASE 3: Deploy Event De-duplication & Grouping                         |
| Aggregate redundant alerts and implement temporal-topological rules.    |
+-------------------------------------------------------------------------+
                                     |
                                     v
+-------------------------------------------------------------------------+
| PHASE 4: Introduce Machine Learning & Dynamic Baselines                 |
| Train analytical models on historical data to replace fixed thresholds. |
+-------------------------------------------------------------------------+
                                     |
                                     v
+-------------------------------------------------------------------------+
| PHASE 5: Enable Root-Cause Mapping & Deployment Tracking               |
| Ingest deployment feeds and change logs to assist incident triage.      |
+-------------------------------------------------------------------------+
                                     |
                                     v
+-------------------------------------------------------------------------+
| PHASE 6: Implement Guardrailed Remediation Automation                   |
| Execute low-risk, deterministic runbooks automatically with audit logging|
+-------------------------------------------------------------------------+
Execution Steps
- Establish Baseline Telemetry Standards: Require application teams to produce structured JSON logs, unified metric naming schemes, and OpenTelemetry trace propagation across microservices.
- Prioritize Alert Noise Suppression: Address alert fatigue first. Grouping identical alerts and suppressing secondary notifications provides immediate value without risking automated instability.
- Maintain Dynamic Topology Maps: Ensure your infrastructure topology dynamically syncs with cloud provisioning APIs and service discovery systems to keep correlation engines accurate.
- Implement Automated Actions Incrementally: Begin automation with non-destructive, read-only operational tasks (e.g., executing diagnostic commands, gathering thread dumps) before enabling auto-remediation scripts.
Skills and Development for AIOps Engineers
As organizations implement algorithmic operations, SREs and system engineers must expand their skill sets to manage data-driven operational tooling.
Core Competencies for the Modern AIOps Engineer
                 +---------------------------------------+
                 |       AIOPS ENGINEER TECHNICAL SKILLS |
                 +---------------------------------------+
                                     |
         +---------------------------+---------------------------+
         |                           |                           |
         v                           v                           v
+-----------------+         +-----------------+         +-----------------+
| SYSTEMS & CLOUD |         | DATA ENGINEERING|         | AUTOMATION & SRE|
| - Linux Kernel Basics   | - Python Data Ecosystem | - Declarative IaC|
| - Cloud Architecture    | - Time-Series Analysis  | - Continuous Delivery|
| - Distributed Networks  | - Streaming Data Infra  | - Orchestration Engines|
+-----------------+         +-----------------+         +-----------------+
Professional Skill Advancement
Structured AIOps Training or an enterprise AIOps Course should emphasize practical technical engineering over abstract theory:
- Observability Engineering: Configuring streaming collectors, managing time-series database indexing, and designing high-cardinality schema strategies.
- Operational Data Pipelines: Setting up scalable message brokers (e.g., Apache Kafka) and stream processing engines (e.g., Vector, Apache Flink).
- Applied Data Science: Using tools like Python, Pandas, and Scikit-learn to clean time-series datasets and evaluate anomaly detection output quality.
- Orchestration Engineering: Writing secure, idempotent runbook automation scripts integrated with cloud APIs and event-driven architectures.
Engineers seeking practical technical resources, conceptual architectures, and hands-on guides can leverage dedicated educational hubs like TheAIOps to build skills across these operational disciplines.
Common Operational Challenges and Pitfalls
- Poor Telemetry Quality: Ingesting unstructured, unparsed, or missing log data into machine learning models yields unreliable outputs. Data hygiene must precede model deployment.
- Opaque Analytics Models: Operations teams tend to disregard recommendations generated by obscure, “black-box” systems. Prioritize models that expose clear reasoning for their conclusions.
- Unbounded Automation: Triggering automated remediation scripts without strict rate limits or safety boundaries can turn minor performance anomalies into widespread service outages.
- Decoupled Deployment Feeds: Isolating deployment systems from observability tools obscures the single most common cause of production outages: recent software or configuration changes.
AIOps Platform Evaluation Matrix
Use this checklist when assessing an AIOps Platform, consulting engagement, or internal engineering project:
+------------------------------------------------------------------------------+
|                     AIOPS TECHNICAL EVALUATION MATRIX                        |
+------------------------------------------------------------------------------+
| [ ] 1. TELEMETRY AGNOSTICISM                                                 |
|     Can the system ingest metrics, logs, traces, and topology natively?      |
|                                                                              |
| [ ] 2. OPEN INTEGRATION ARCHITECTURE                                         |
|     Are there robust REST/gRPC APIs and open-source collector integrations?   |
|                                                                              |
| [ ] 3. MODEL TRANSPARENCY                                                    |
|     Does the platform present readable explanations for its recommendations? |
|                                                                              |
| [ ] 4. MEASURABLE DE-DUPLICATION                                             |
|     Does the correlation engine prove alert noise reduction on real logs?    |
|                                                                              |
| [ ] 5. AUDITABLE AUTOMATION CONTROLS                                         |
|     Are there granular RBAC settings, approval steps, and execution logs?    |
+------------------------------------------------------------------------------+
Key Takeaways
- AIOps Serves as an Operational Force Multiplier: Artificial Intelligence for IT Operations enhances SRE capabilities by sifting through telemetry noise; it complements rather than replaces human domain expertise.
- Data Hygiene is Essential: High-quality, structured logs and standardized metric formats are fundamental requirements for accurate machine learning insights.
- Address Alert Fatigue First: Focus on alert de-duplication and event correlation before attempting complex predictive modeling or automated remediation.
- Incorporate Change Context: Connect continuous delivery pipelines and infrastructure provisioning feeds directly to your AIOps platform to accelerate triage.
- Enforce Safety Guardrails: Ensure all automated remediation scripts incorporate execution limits, rollback options, and comprehensive audit logging.
Frequently Asked Questions
What is AIOps?
AIOps, or Artificial Intelligence for IT Operations, combines machine learning, big data streaming, and operational analytics to automate telemetry processing, correlate alerts, detect anomalies, and support root-cause analysis in complex IT environments.
How does AIOps differ from traditional monitoring?
Traditional monitoring evaluates static, hardcoded thresholds that often produce false positives or alert fatigue. AIOps uses statistical baselining and machine learning to evaluate historical trends dynamically, identifying anomalies based on shifting system context.
Does deploying AIOps remove the need for human SREs?
No. AIOps tools act as decision-support systems designed to reduce manual toil and alert noise. Human engineers remain necessary to make complex architectural decisions, manage major outages, and oversee automated remediation guardrails.
What core technical skills does an AIOps Engineer need?
An effective AIOps Engineer requires a foundation in systems engineering (Linux, cloud infrastructure, networking), software development (Python, Go), data pipeline management (Kafka, Vector), and observability principles (metrics, structured logging, distributed tracing).
What are the main components of an AIOps architecture?
A typical architecture features a streaming data ingestion layer, time-series metrics store, topology mapping service, machine learning inference engine (for anomaly detection and correlation), incident visualization tier, and automation execution layer.
How does event correlation reduce alert noise?
Correlation algorithms analyze raw alert feeds and group related notifications using temporal proximity, topological service dependencies, and log message structure similarity, condensing multi-alert noise storms into a single consolidated incident ticket.
What is automated remediation in AIOps?
Automated remediation involves triggering predefined programmatic runbooks—such as clearing temporary caches, rotating credentials, or restarting stalled processes—in response to verified system events without requiring manual human steps.
Why is standardized telemetry critical for AIOps?
Machine learning models rely entirely on consistent, high-quality data. Poorly formatted logs, missing timestamps, or inconsistent metric naming prevent analytical models from identifying patterns, leading to missed incidents or false flags.
How does AIOps support Site Reliability Engineering practices?
AIOps directly supports SRE objectives by eliminating operational toil, calculating dynamic Service Level Indicators (SLIs), detecting Service Level Objective (SLO) burn rates early, and drastically reducing Mean Time to Resolution (MTTR).
Where should an organization begin when implementing AIOps?
Begin by evaluating telemetry quality, standardizing log formats, and consolidating event management. Prioritize cross-tool alert correlation and noise reduction first before introducing advanced predictive models or autonomous self-healing workflows.
Conclusion
Artificial Intelligence for IT Operations represents a major evolutionary step in managing distributed software environments. By using statistical modeling and machine learning algorithms to process high-velocity telemetry, AIOps transforms raw operational metrics, logs, and traces into clear, actionable intelligence.However, success with AIOps relies on sound operational practices. High-quality data pipelines, dynamic topology tracking, transparent analytical models, and strict automation safety controls remain mandatory. When implemented alongside established DevOps and SRE frameworks, AIOps empowers engineering teams to detect anomalies early, shorten MTTR, and maintain resilient systems.
Leave a Reply